
Sensible Data : Consumer Expenditures Up and Home Sales Down in April 2026
No Surprise in the House Sales and PCE Data for Anyone Who Has Heard About the Iran War, A Steep Climb in the 10-Year Treasury, and 30-Year Mortgage Rates

President Trump may not be concerned about the rising cost of gasoline, but consumers were feeling the pinch in April. The pain of the pinch was not only at the gas pump. Prospective home buyers got stung in March and April with 30-year mortgage rates nearing 50 basis points above the pre-war level. (Rates rose even higher in May.)
New Home Sales in April 2026
Starting with new home sales (and we will discuss the consumer and consumer prices in another post), April disappointed but did not surprise. After a robust March:
The Census Bureau reported lackluster new home sales of 622,000 seasonally adjusted, down from 663,000 in March.
Year-over-year, new home sales dropped almost 80,000 units, marking an 11.26% decline from April 2025.
The 12-month trailing average slid to 665,000 from 672,000 in March and 679,000 in April 2025.
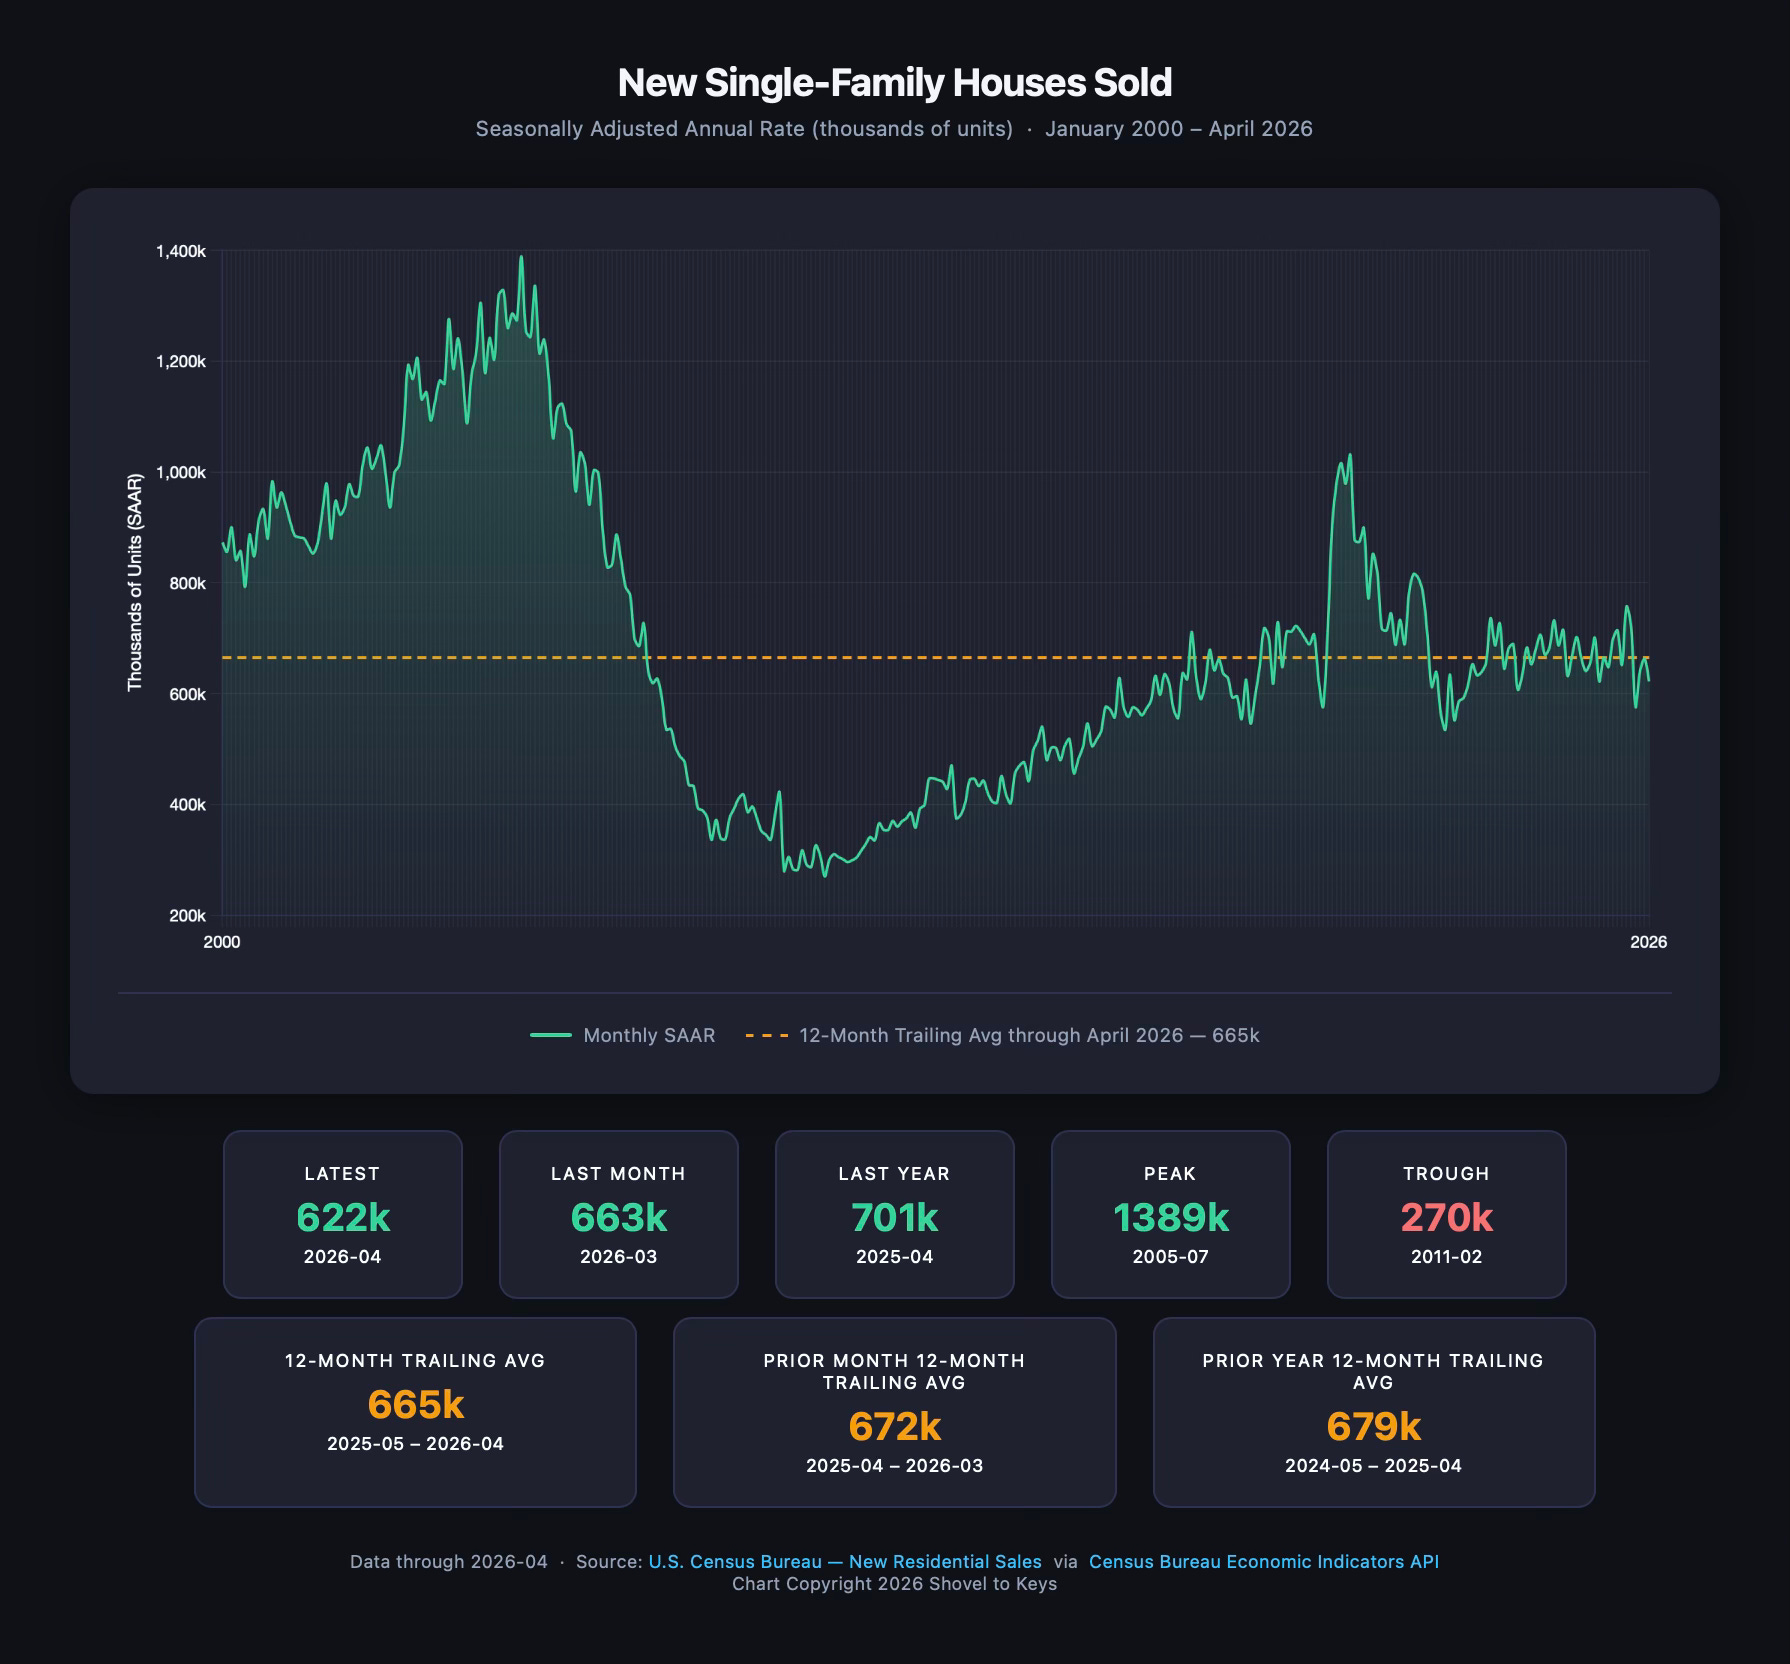
April new home sales declined markedly for obvious reasons. The 30-year mortgage rate rose from below 6.0% before the Iran war began in late February to nearly 6.5%. On February 24, 2026, Mortgage New Daily reported a 30-year rate of 5.99% but a rate of 6.45% on April 30. Inflation spiked. Consumer sentiment (but not consumer confidence) slid to the lowest level measured in almost 50 years. We will discuss inflation and consumer emotions in a post later this week.
With so much tumult in the economy and the world, consumer hesitation to make major purchase decisions is to be expected. A more interesting question may be provoked by the stability of the new home sales trend over the past few years.
A Comment about Balance
For many observers of the home sales market, nirvana is balance. Balance could be measured by months of inventory (typically four to six months of inventory), stable prices (rising just a bit faster than inflation), a steady average number of days-on-market (between 30 and 45 days), or just the sense that the number of buyers and sellers is roughly equal. Shovel To Keys (and probably many other data junkies) has begun calculating a 12-month trailing average for the data sets we track. The 12-month trailing average of any metric smooths short-term spikes and plunges and better uncovers trends from which more meaning can be gleaned.
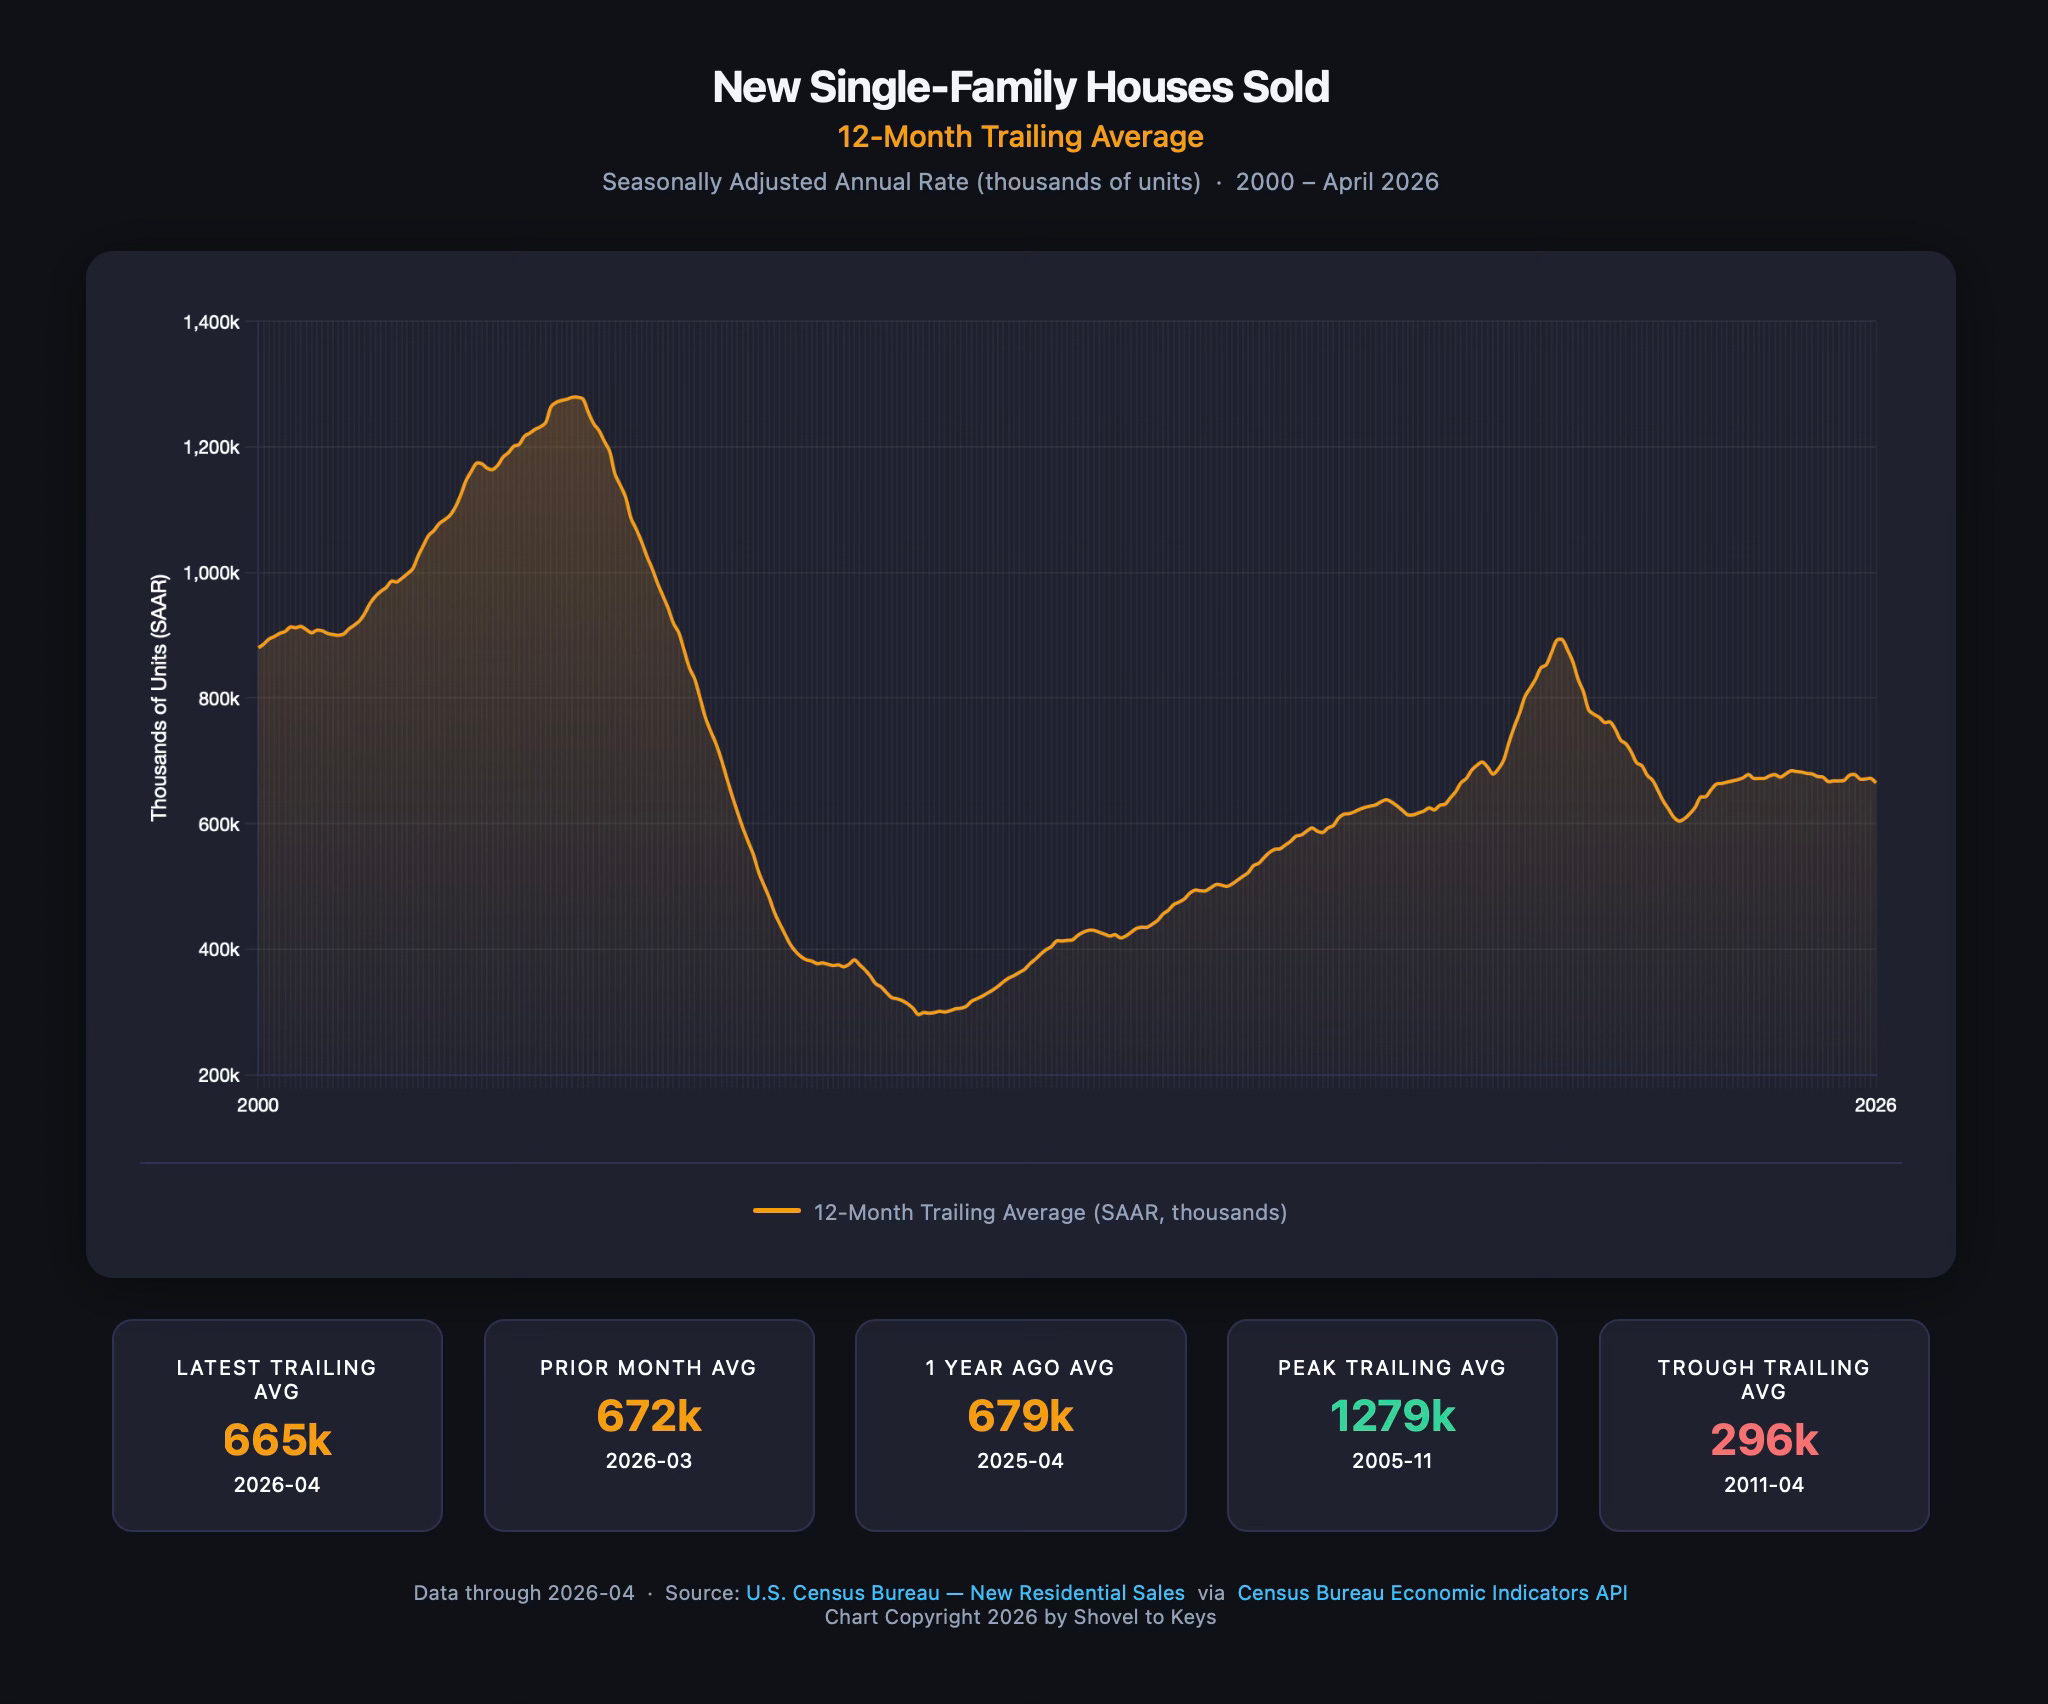
The chart above exemplifies the utility of trailing averages. The recent data (better illustrated below) shows a fairly steady state of new home sales since mid 2023. During the Covid pandemic, the 12-month trailing average spiked significantly because sales skyrocketed. (A spike of similar trajectory but greater amplitude and duration occurred from the early 2000s to 2008.). The average descended almost as quickly after the pandemic home buying frenzy. Since 2023, a 12-month trailing average in the mid-600s has prevailed.
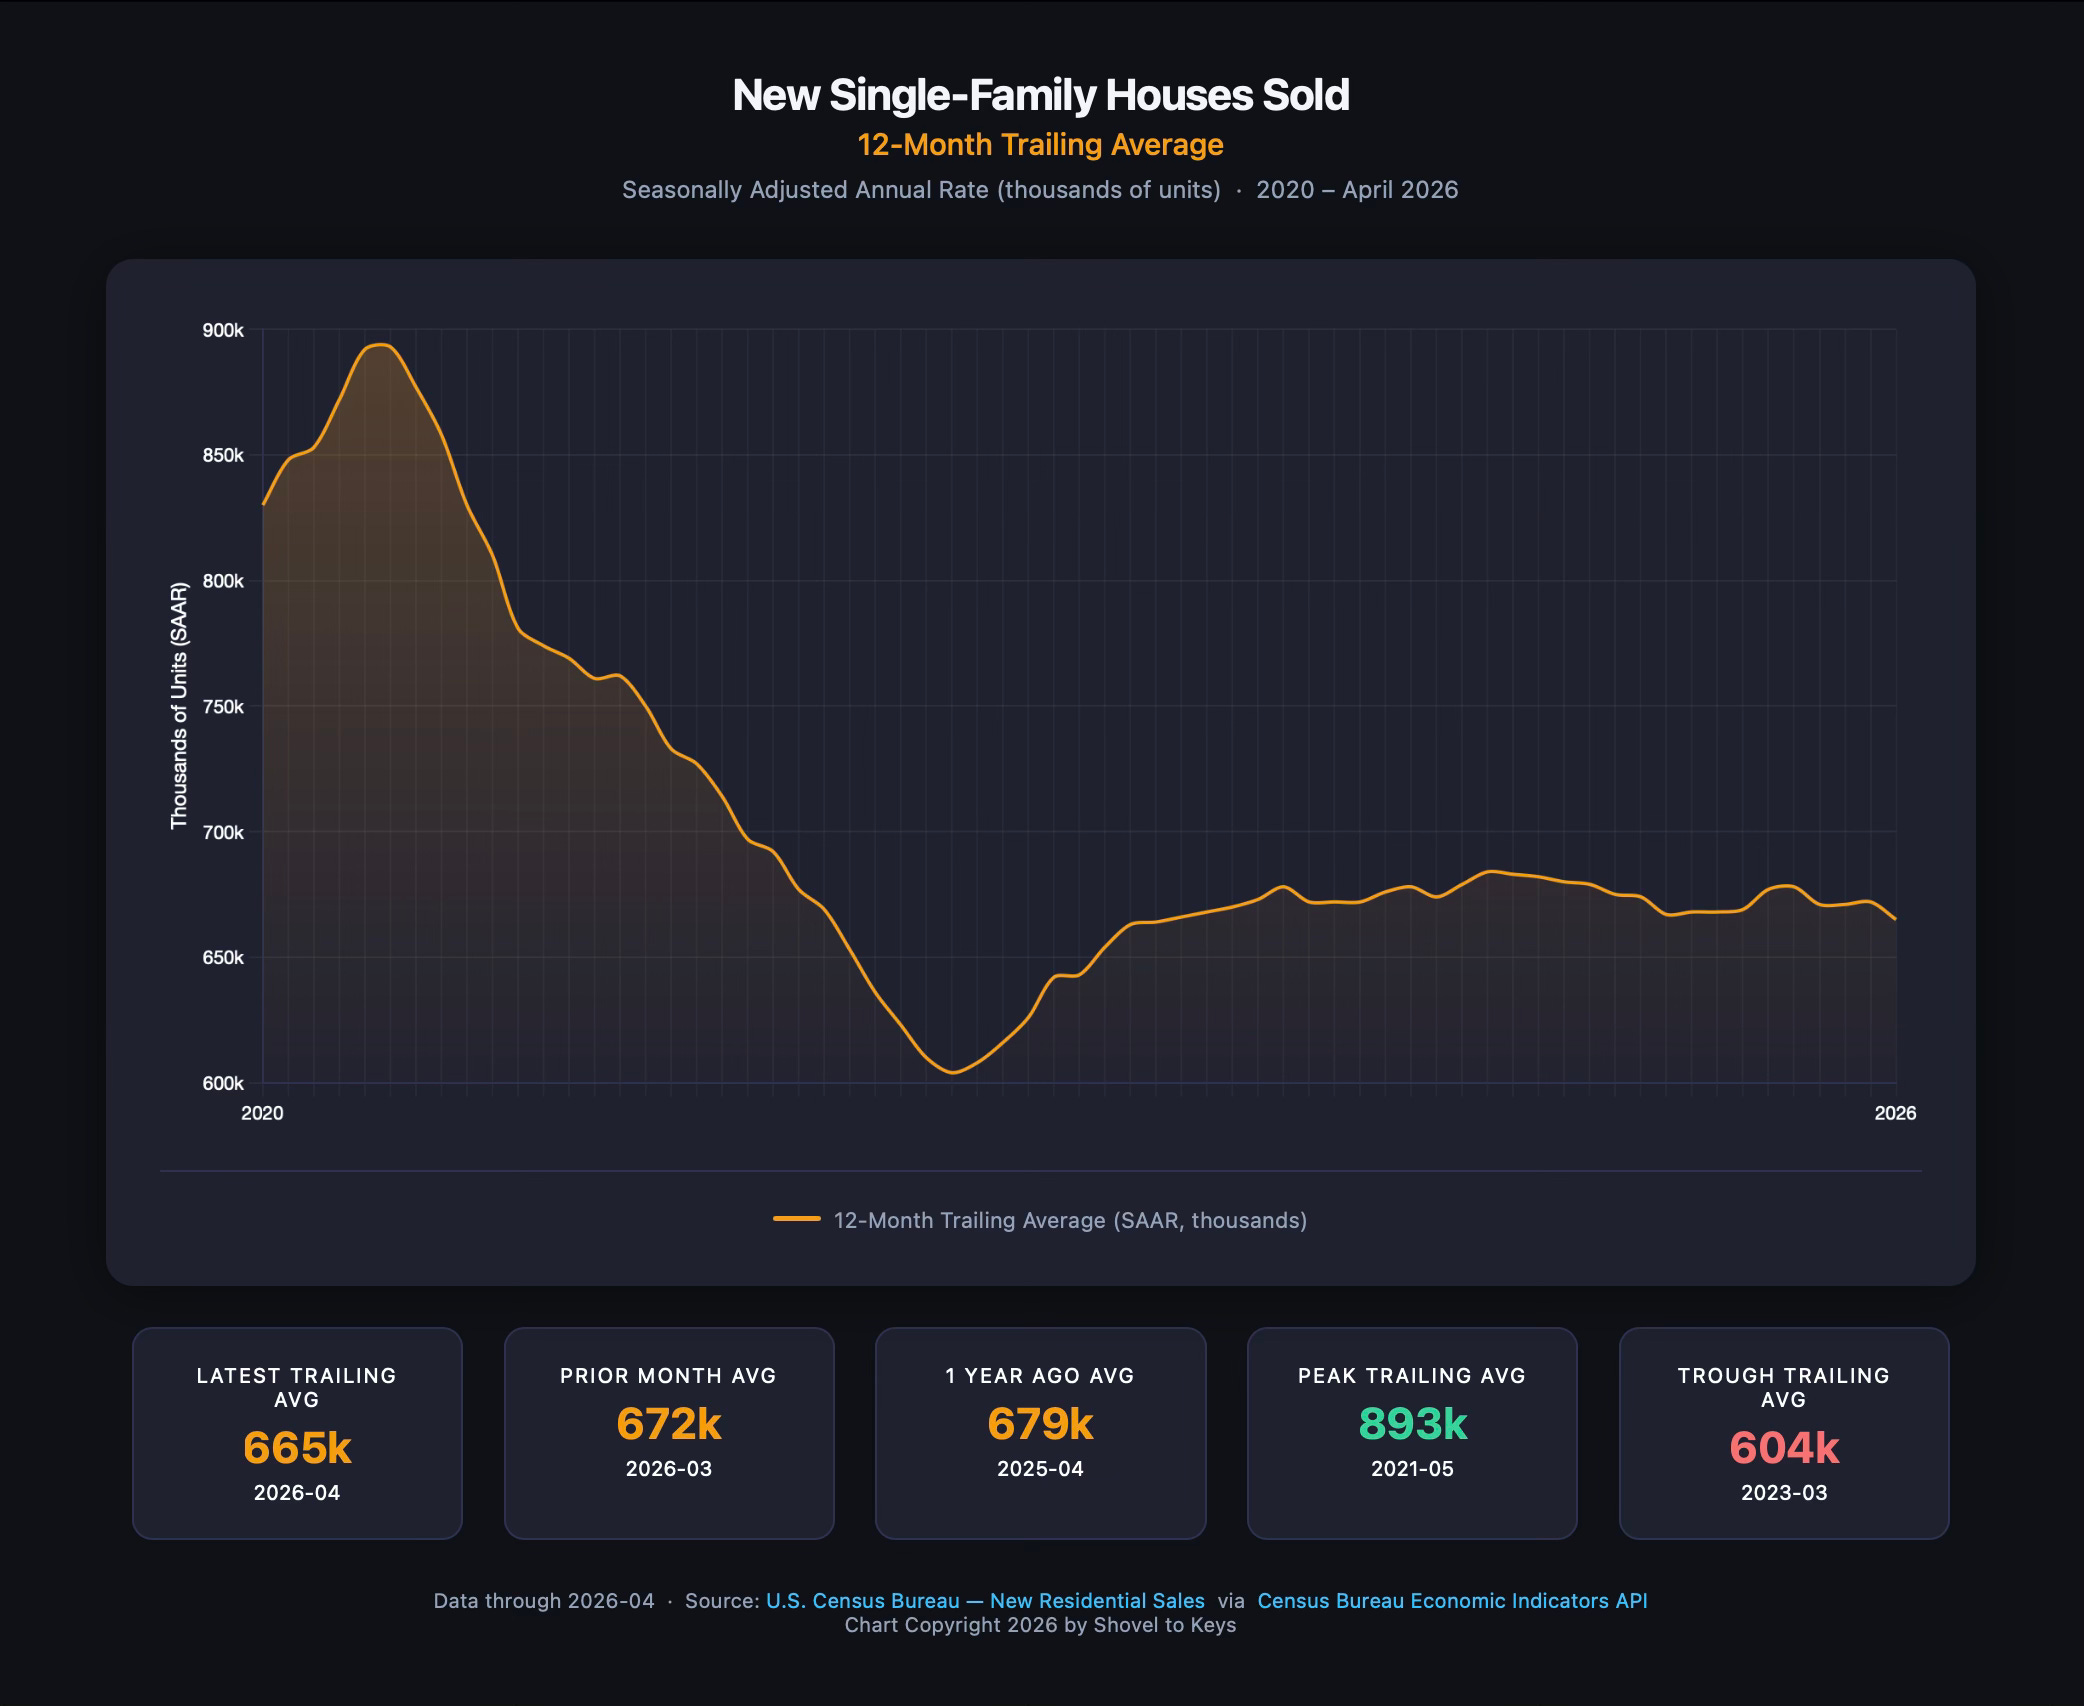
The 12-month trailing average charge for a shorter date range shows the stability in the new home sales market over the past few years. Despite unusual influences (war, challenge to the independence of the Federal Reserve, spasmodic tariffs), the 12-month average has not varied very much since mid 2023. The question to be answered is why the new home market has experienced sales volume stability not seen since before 2000.
We will come back to the question, but chime in with your idea in the comments.